


D3.js (Data-Driven Documents) is a powerful JavaScript library used for creating dynamic and interactive data visualizations on the web. With D3.js, creating an area chart is straightforward and customizable.
To create an area chart using D3.js, you would start by defining the dimensions of the chart and creating a scale for the X and Y axis. Then, you would use D3.js to create the area based on the data and the scales. You can customize the appearance of the chart by adjusting the color, opacity, and stroke of the area.
D3.js also provides many tools for adding interactivity to the chart. For example, you could use D3.js to add tooltips, highlight the area on hover, or animate the chart over time.
Overall, D3.js provides a flexible and powerful framework for creating customized area charts and other data visualizations on the web. In this blog, we will go over the steps to create an area chart using D3.js in a React.js project.
Prerequisites
Before we get started, ensure that you have the following prerequisites:
Basic knowledge of HTML, CSS, and JavaScript
Node.js and npm installed on your system
A text editor like Visual Studio Code
Getting started
Let's create a new React.js project by running the following command in your terminal:
npx create-react-app responsive-area-chart-using-d3js-reactjs
This command creates a new React.js project with the name responsive-area-chart-using-d3js-reactjs. Navigate to the project directory by running the following command:
cd responsive-area-chart-using-d3js-reactjs
Open the project directory in your text editor. Next, install the d3 library by running the following command:
npm install d3
This command installs the latest version of the d3 library in your project.
Creating the area chart component
Create a new file named AreaChart.tsx in the src/features directory of your project. This file will contain the code for the area chart component. Here's the code for the component:
import * as d3 from 'd3';
import { FC, useEffect, useRef } from 'react';

import Spinner from 'components/Spinner';
import { useResizeObserver } from 'hooks/useResizeObserver';

const AreaChart: FC<IChart> = ({ data, svgWrapperRef, margin, isYaxisRight = false }) => {
  const dimensions: any = useResizeObserver(svgWrapperRef);
  const svgRef = useRef<SVGSVGElement>(null);

  useEffect(() => {
    if (!svgRef?.current || !dimensions) return;

    // Initialize the height, width and max value
    const innerWidth: number = dimensions?.width - margin?.right;
    const innerHeight: number = dimensions?.height - (margin?.top + margin?.bottom);
    const maxValue: number = Math.max(...data?.map(({ value }) => value));

    const svg = d3.select(svgRef?.current);
    svg.selectAll('.dot').remove();
    svg.selectAll('.line').remove();
    svg.selectAll('.grid').remove();

    // Create x-axis scale
    const xScale: any = d3
      .scalePoint()
      .domain([...data?.map(({ label }) => label)])
      .range([margin?.left, innerWidth]);

    // Create y-axis scale
    const yScale: any = d3.scaleLinear().domain([0, maxValue]).rangeRound([innerHeight, margin?.top]);

    // Create x-axis
    const xAxis: any = d3.axisBottom(xScale).ticks(data?.length);
    svg
      .select('.x-axis')
      .style('transform', `translateY(${innerHeight}px)`)
      .style('color', 'steelblue')
      .style('font-size', 10)
      .call(xAxis)
      .selectAll('text')
      .style('text-anchor', 'end')
      .attr('dx', '-5px')
      .attr('dy', '4px')
      .attr('transform', 'rotate(-30)');

    // Create y-axis for left side
    const yAxis: any = d3.axisLeft(yScale).ticks(5);
    svg
      .select('.y-axis')
      .style('transform', `translateX(${margin?.left}px)`)
      .style('color', 'steelblue')
      .style('font-size', 10)
      .call(yAxis);

    // Create y-axis for right side
    const yAxisRight: any = d3.axisRight(yScale).ticks(5);
    svg
      .select('.y-axis-right')
      .style('transform', `translateX(${dimensions?.width - margin?.right}px)`)
      .style('color', 'steelblue')
      .style('font-size', 10)
      .call(yAxisRight);

    // Draw the area
    const areaGenerator = d3
      .area<IData>()
      .x((d: any) => xScale(d.label))
      .y0(innerHeight)
      .y1((d: any) => yScale(d.value))
      .curve(d3.curveMonotoneX);

    svg
      .select('.area')
      .datum([...data])
      .attr('fill', 'steelblue')
      .attr('d', areaGenerator as any)
      .attr('opacity', 0.25);

    svg
      .selectAll('.dot')
      .data([...data])
      .enter()
      .append('circle')
      .attr('class', 'dot')
      .attr('cx', ({ label }) => xScale(label))
      .attr('cy', ({ value }) => yScale(value))
      .attr('r', 5)
      .style('cursor', 'pointer')
      .attr('fill', ({ fillColor }) => fillColor)
      .on('mouseenter', (event, item) => {
        svg
          .selectAll('.tooltip')
          .data([item?.value])
          .join((enter) => enter.append('text').attr('y', yScale(item?.value) - 4))
          .attr('class', 'tooltip')
          .text(`${item?.value}`)
          .attr('x', xScale(item?.label))
          .style('font-size', '10px')
          .attr('text-anchor', 'middle')
          .transition()
          .duration(500)
          .attr('y', yScale(item?.value) - 8)
          .style('font-size', '14px')
          .style('fill', item?.fillColor)
          .style('opacity', 1);
      })
      .on('mouseleave', () => svg.select('.tooltip').remove());

    // Draw the line for area
    const lineGenerator = d3
      .line<IData>()
      .x(({ label }) => xScale(label))
      .y(({ value }) => yScale(value))
      .curve(d3.curveMonotoneX);

    svg
      .append('path')
      .data([data])
      .attr('stroke', 'steelblue')
      .attr('fill', 'none')
      .attr('class', 'line')
      .attr('d', lineGenerator);
  }, [data, dimensions]);

  if (!dimensions) {
    return (
      <div className="flex w-full justify-center items-center py-2">
        <Spinner className="text-gray-300 h-8 w-8" />
      </div>
    );
  }

  return (
    <div className="d3js">
      <svg ref={svgRef} width={`${dimensions?.width}`} height={dimensions?.height}>
        <g className="x-axis" />
        {isYaxisRight ? <g className="y-axis-right" /> : <g className="y-axis" />}
        <path className="area" />
      </svg>
    </div>
  );
};

interface IData {
  label: string;
  value: number;
  fillColor: string;
}

interface IChart {
  data: IData[];
  svgWrapperRef: any;
  margin: {
    top: number;
    right: number;
    bottom: number;
    left: number;
  };
  isYaxisRight?: boolean;
}

export default AreaChart;
The above code is a React functional component, implementing an area chart using the D3.js library. The chart takes data as input, along with optional arguments to set the margins of the chart and whether the y-axis is on the right or left side. It uses the useResizeObserver hook to resize the chart when its container changes size. The chart is drawn in the useEffect hook, which is called whenever the data or dimensions change. The d3 library is used to create the x and y scales, axes, area, and line. Tooltips are added to show the exact value of each point on the chart when hovering over it with the mouse. The chart also shows a spinner while waiting for the dimensions to be calculated.
Let’s import the AreaChart component in the app.tsx or other components and pass the props. Here's the code for the app.tsx
import { useEffect, useRef, useState } from 'react';
import AreaChart from './AreaChart';
import { randomNumber } from 'utils/helpers';
const Feature = () => {
const margin = { top: 20, right: 10, bottom: 20, left: 30 };
const [data, setData] = useState<any[]>([]);
const svgLargeRef: any = useRef<SVGSVGElement>();
const svgMediumRef: any = useRef<SVGSVGElement>();
const svgSmallRef: any = useRef<SVGSVGElement>();
useEffect(() => {
const makeRandomData = () => {
setData([]);
['JS', 'Python', '.Net', 'Java', 'GoLang', 'UI/UX']?.map((label) => {
setData((prevData) => [...prevData, { label, value: randomNumber(10, 99), fillColor: `#${randomNumber()}` }]);
});
setTimeout(() => {
makeRandomData();
}, 1000 * 10);
};
makeRandomData();
}, []);
return (
<div className="relative px-5 py-2">
<div className="flex justify-center">
<div className="w-[90vw] h-full">
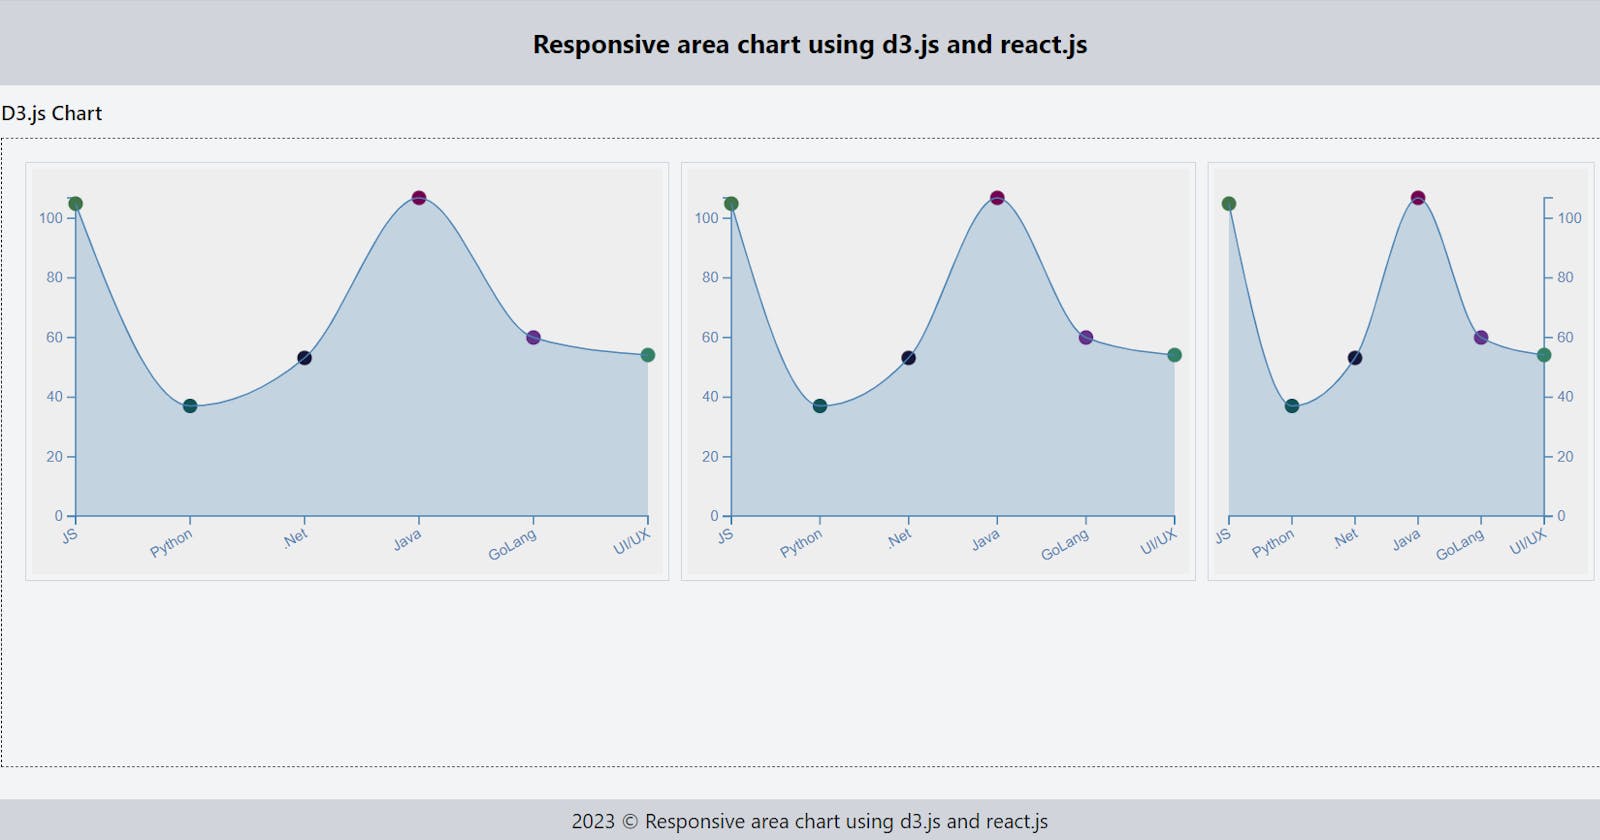
<h2 className="flex justify-between items-center font-semibold text-black mb-2">D3.js Chart</h2>
<div className="flex w-full h-[75vh] justify-center items-start border border-dashed border-black text-white p-4 space-x-2">
<div ref={svgLargeRef} className="w-5/12 h-72 border border-gray-300 p-1">
<AreaChart data={data} svgWrapperRef={svgLargeRef} margin={margin} isYaxisRight={false} />
</div>
<div ref={svgMediumRef} className="w-4/12 h-72 border border-gray-300 p-1">
<AreaChart data={data} svgWrapperRef={svgMediumRef} margin={margin} isYaxisRight={false} />
</div>
<div ref={svgSmallRef} className="w-3/12 h-72 border border-gray-300 p-1">
<AreaChart
data={data}
svgWrapperRef={svgSmallRef}
margin={{ ...margin, left: 10, right: 30 }}
isYaxisRight={true}
/>
</div>
</div>
</div>
</div>
</div>
);
};
export default Feature;
The above code defines a React functional component named Feature which imports the useEffect, useRef, and useState hooks from the react library. It also imports an AreaChart component and a randomNumber function from two other files.
Within the Feature component, it sets up three SVG elements using the useRef hook, each with a different width and height. It also sets up an empty array of data using the useState hook.
The useEffect hook is used to create a function called makeRandomData which is called once when the component mounts. The makeRandomData function generates new random data for the data array using the randomNumber function, and updates it every 10 seconds using setTimeout.
The return statement returns a JSX element with the three SVG elements wrapped in a parent div. Each SVG element is passed to the AreaChart component along with the data, margin, and isYaxisRight props. Finally, the Feature component is exported as the default export of this file.
Summary
Overall, the blog post provides a clear and detailed explanation of how to use d3.js to create a responsive area chart in a React.js application, making it a useful resource for anyone looking to visualize their data in this way.
I hope you found this tutorial helpful! If you have any questions or feedback, feel free to let me know.