

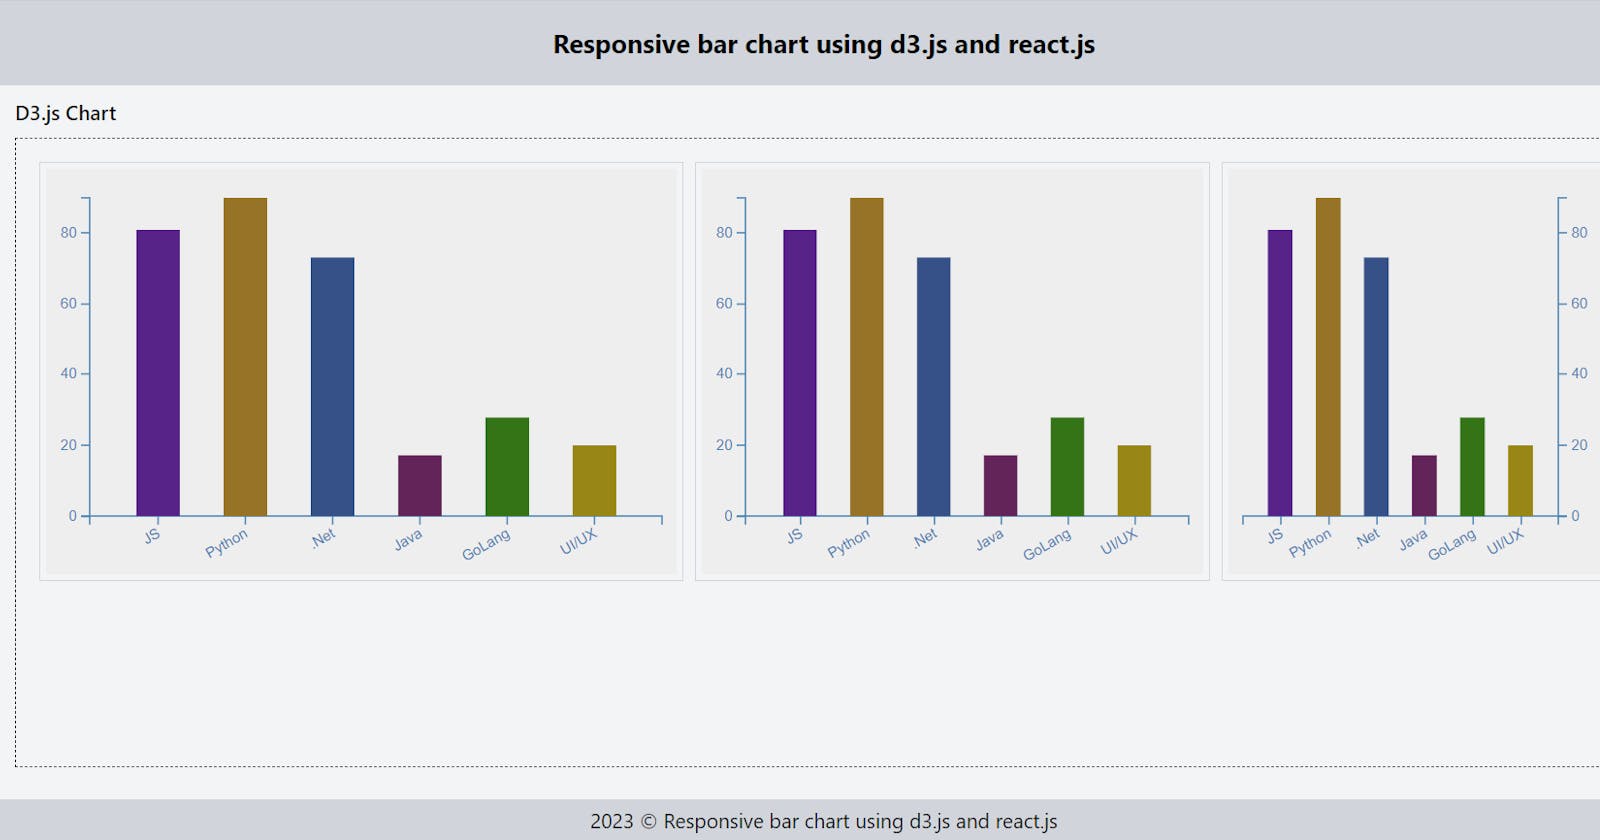


Data visualization is an essential aspect of data analysis, and bar charts are a popular choice to display data. D3.js is a powerful library for creating data visualizations, and React.js is a popular JavaScript library for building user interfaces. In this blog, we will explore how to create a bar chart using D3.js in a React.js application.
Prerequisites
Before we get started, ensure that you have the following prerequisites:
Basic knowledge of HTML, CSS, and JavaScript
Node.js and npm installed on your system
A text editor like Visual Studio Code
Getting started
Let's create a new React.js project by running the following command in your terminal:
npx create-react-app responsive-bar-chart-using-d3js-reactjs
This command creates a new React.js project with the name responsive-bar-chart-using-d3js-reactjs. Navigate to the project directory by running the following command:
cd responsive-bar-chart-using-d3js-reactjs
Open the project directory in your text editor. Next, install the d3 library by running the following command:
npm install d3
This command installs the latest version of the d3 library in your project.
Creating the bar chart component
Create a new file named BarChart.tsx in the src/features directory of your project. This file will contain the code for the bar chart component. Here's the code for the component:
import * as d3 from 'd3';
import { FC, useEffect, useRef } from 'react';

import Spinner from 'components/Spinner';
import { useResizeObserver } from 'hooks/useResizeObserver';

const BarChart: FC<IChart> = ({ data, svgWrapperRef, margin, isYaxisRight = false }) => {
  const dimensions: any = useResizeObserver(svgWrapperRef);
  const svgRef = useRef<SVGSVGElement>(null);

  useEffect(() => {
    if (!svgRef?.current || !dimensions) return;

    // Initialize the height, width, and max value
    const innerWidth: number = dimensions?.width - margin?.right;
    const innerHeight: number = dimensions?.height - (margin?.top + margin?.bottom);
    const maxValue: number = Math.max(...data?.map(({ value }) => value));

    const svg = d3.select(svgRef?.current);

    // Create x-axis scale
    const xScale: any = d3
      .scaleBand()
      .domain([...data?.map(({ label }) => label)])
      .rangeRound([margin?.left, innerWidth])
      .padding(0.5);

    // Create y-axis scale
    const yScale: any = d3.scaleLinear().domain([0, maxValue]).rangeRound([innerHeight, margin?.top]);

    // Create x-axis
    const xAxis: any = d3.axisBottom(xScale).ticks(data?.length);
    svg
      .select('.x-axis')
      .style('transform', `translateY(${innerHeight}px)`)
      .style('color', 'steelblue')
      .style('font-size', 10)
      .call(xAxis)
      .selectAll('text')
      .style('text-anchor', 'end')
      .attr('dx', '-5px')
      .attr('dy', '4px')
      .attr('transform', 'rotate(-30)');

    // Create y-axis for left side
    const yAxis: any = d3.axisLeft(yScale).ticks(5);
    svg
      .select('.y-axis')
      .style('transform', `translateX(${margin?.left}px)`)
      .style('color', 'steelblue')
      .style('font-size', 10)
      .call(yAxis);

    // Create y-axis for right side
    const yAxisRight: any = d3.axisRight(yScale).ticks(5);
    svg
      .select('.y-axis-right')
      .style('transform', `translateX(${dimensions?.width - margin?.right}px)`)
      .style('color', 'steelblue')
      .style('font-size', 10)
      .call(yAxisRight);

    // Draw the bars
    svg
      .selectAll('.bar')
      .data([...data])
      .join('rect')
      .attr('class', 'bar')
      .style('transform', 'scale(1, -1)')
      .attr('x', ({ label }) => xScale(label))
      .attr('width', xScale.bandwidth())
      .attr('y', -innerHeight)
      .style('cursor', 'pointer')
      .style('fill', ({ fillColor }) => fillColor)
      .on('mouseenter', (event, item) => {
        svg
          .selectAll('.tooltip')
          .data([item?.value])
          .join((enter) => enter.append('text').attr('y', yScale(item?.value) - 4))
          .attr('class', 'tooltip')
          .text(`${item?.value}`)
          .attr('x', xScale(item?.label) + xScale.bandwidth() / 2)
          .style('font-size', '10px')
          .attr('text-anchor', 'middle')
          .transition()
          .duration(500)
          .attr('y', yScale(item?.value) - 8)
          .style('font-size', '14px')
          .style('fill', item?.fillColor)
          .style('opacity', 1);
      })
      .on('mouseleave', () => svg.select('.tooltip').remove())
      .transition()
      .style('fill', ({ fillColor }) => fillColor)
      .attr('height', ({ value }) => innerHeight - yScale(value));
  }, [data, dimensions]);

  if (!dimensions) {
    return (
      <div className="flex w-full justify-center items-center py-2">
        <Spinner className="text-gray-300 h-8 w-8" />
      </div>
    );
  }

  return (
    <div className="d3js">
      <svg ref={svgRef} width={`${dimensions?.width}`} height={dimensions?.height}>
        <g className="x-axis" />
        {isYaxisRight ? <g className="y-axis-right" /> : <g className="y-axis" />}
      </svg>
    </div>
  );
};

interface IData {
  label: string;
  value: number;
  fillColor: string;
}

interface IChart {
  data: IData[];
  svgWrapperRef: any;
  margin: {
    top: number;
    right: number;
    bottom: number;
    left: number;
  };
  isYaxisRight?: boolean;
}

export default BarChart;
In the above code, we import FC, useRef, and useEffect from the react library and import the d3 library. We also define a new component named BarChart that takes four props: data, svgWrapperRef, margin, and isYaxisRight. The component returns an SVG element with a ref to the svgRef variable.
We use the useEffect hook to add the D3.js code for the bar chart. We also pass the data, and dimensions, props to the dependencies array of the useEffect hook so that the code inside the hook runs every time any of these props change.
Let’s import the BarChart component in the app.tsx or other components and pass the props. Here's the code for the app.tsx
import { useEffect, useRef, useState } from 'react';

import BarChart from './BarChart';
import { randomNumber } from 'utils/helpers';

const Feature = () => {
  const margin = { top: 20, right: 10, bottom: 20, left: 30 };
  const [data, setData] = useState<any[]>([]);
  const svgLargeRef: any = useRef<SVGSVGElement>();
  const svgMediumRef: any = useRef<SVGSVGElement>();
  const svgSmallRef: any = useRef<SVGSVGElement>();

  useEffect(() => {
    const makeRandomData = () => {
      setData([]);
      ['JS', 'Python', '.Net', 'Java', 'GoLang', 'UI/UX']?.map((label) => {
        setData((prevData) => [...prevData, { label, value: randomNumber(10, 99), fillColor: `#${randomNumber()}` }]);
      });

      setTimeout(() => {
        makeRandomData();
      }, 1000 * 10);
    };

    makeRandomData();
  }, []);

  return (
    <div className="relative px-5 py-2">
      <div className="flex justify-center">
        <div className="w-[90vw] h-full">
          <h2 className="flex justify-between items-center font-semibold text-black mb-2">D3.js Chart</h2>
          <div className="flex w-full h-[75vh] justify-center items-start border border-dashed border-black text-white p-4 space-x-2">
            <div ref={svgLargeRef} className="w-5/12 h-72 border border-gray-300 p-1">
              <BarChart data={data} svgWrapperRef={svgLargeRef} margin={margin} isYaxisRight={false} />
            </div>
            <div ref={svgMediumRef} className="w-4/12 h-72 border border-gray-300 p-1">
              <BarChart data={data} svgWrapperRef={svgMediumRef} margin={margin} isYaxisRight={false} />
            </div>
            <div ref={svgSmallRef} className="w-3/12 h-72 border border-gray-300 p-1">
              <BarChart
                data={data}
                svgWrapperRef={svgSmallRef}
                margin={{ ...margin, left: 10, right: 30 }}
                isYaxisRight={true}
              />
            </div>
          </div>
        </div>
      </div>
    </div>
  );
};

export default Feature;
Summary
That's it! You should now have a basic bar chart that displays your data. From here, you can customize the styling and add interactivity as needed.
I hope you found this tutorial helpful! If you have any questions or feedback, feel free to let me know.