


Pie charts are an effective way to represent data as a proportion of a whole. D3.js is a popular JavaScript library that provides various tools for data visualization. In this blog, we will go over the steps to create a pie chart using D3.js in a React.js project.
Prerequisites
Before we get started, ensure that you have the following prerequisites:
Basic knowledge of HTML, CSS, and JavaScript
Node.js and npm installed on your system
A text editor like Visual Studio Code
Getting started
Let's create a new React.js project by running the following command in your terminal:
npx create-react-app responsive-pie-chart-using-d3js-reactjs
This command creates a new React.js project with the name responsive-pie-chart-using-d3js-reactjs. Navigate to the project directory by running the following command:
cd responsive-pie-chart-using-d3js-reactjs
Open the project directory in your text editor. Next, install the d3 library by running the following command:
npm install d3
This command installs the latest version of the d3 library in your project.
Creating the pie chart component
Create a new file named PieChart.tsx in the src/features directory of your project. This file will contain the code for the pie chart component. Here's the code for the component:
import * as d3 from 'd3';
import { FC, useEffect, useRef } from 'react';

import Spinner from 'components/Spinner';
import { useResizeObserver } from 'hooks/useResizeObserver';

const PieChart: FC<IChart> = ({ data, svgWrapperRef, padding }) => {
  const dimensions: any = useResizeObserver(svgWrapperRef);
  const svgRef = useRef<SVGSVGElement>(null);

  useEffect(() => {
    if (!svgRef?.current || !dimensions) return;

    const innerWidth = dimensions?.width;
    const innerHeight = dimensions?.height;
    const radius = Math.min(innerWidth, innerHeight) / 2;

    const svg = d3.select(svgRef?.current);
    svg.selectAll('*').remove();

    const pieGenerator = d3
      .pie<IData>()
      .value(({ value }) => value)
      .sort(null);

    const arcGenerator = d3
      .arc<d3.PieArcDatum<IData>>()
      .innerRadius(0)
      .outerRadius(radius - padding);

    const slices = pieGenerator([...data]);

    // Draw the pie
    svg
      .attr('width', innerWidth)
      .attr('height', innerHeight)
      .append('g')
      .attr('transform', `translate(${innerWidth / 2}, ${innerHeight / 2})`)
      .selectAll('path')
      .data(slices)
      .join('path')
      .attr('fill', (d) => d?.data?.fillColor)
      .attr('d', arcGenerator);

    // Draw the legends box
    svg
      .selectAll('.legends')
      .data(slices)
      .join('rect')
      .attr('transform', `translate(${innerWidth - innerWidth * 0.25})`)
      .attr('y', (d, i) => i * 15 + 10)
      .attr('width', 12)
      .attr('height', 12)
      .style('fill', (d) => d?.data?.fillColor);

    // Draw the legends text
    svg
      .selectAll('.legends-text')
      .data(slices)
      .join('text')
      .attr('transform', `translate(${innerWidth - innerWidth * 0.25 + 20})`)
      .attr('y', (d, i) => i * 15 + 20)
      .text((d) => d?.data?.label)
      .style('font-size', 10)
      .style('fill', (d) => d?.data?.fillColor);

    // Draw the arc text
    svg
      .append('g')
      .attr('transform', `translate(${innerWidth / 2}, ${innerHeight / 2})`)
      .selectAll('text')
      .data(slices)
      .join('text')
      .attr('transform', (d) => `translate(${arcGenerator.centroid(d)})`)
      .style('fill', 'white')
      .style('font-size', 10)
      .attr('dy', '5px')
      .text((d) => d?.data?.value);
  }, [data, dimensions]);

  if (!dimensions) {
    return (
      <div className="flex w-full justify-center items-center py-2">
        <Spinner className="text-gray-300 h-8 w-8" />
      </div>
    );
  }

  return (
    <div className="d3js">
      <svg ref={svgRef} />
    </div>
  );
};

interface IData {
  label: string;
  value: number;
  fillColor: string;
}

interface IChart {
  data: IData[];
  svgWrapperRef: any;
  padding: number;
}

export default PieChart;
The component receives three props: data, an array of objects with label, value, and fillColor properties; svgWrapperRef, a reference to the wrapper element that will contain the chart; and padding, a number used to calculate the radius of the chart.
The component uses the useResizeObserver hook to get the dimensions of the svgWrapperRef element and updates the chart whenever the data or dimensions change. It then uses D3.js to generate the slices of the pie chart using the pieGenerator function and to calculate the arcs for each slice using the arcGenerator function. The component also draws the legend and the values for each slice.
If the dimensions of the wrapper element are not available, a spinner is shown instead.
The component uses TypeScript for type checking and has two interfaces: IData for the data objects and IChart for the component props.
Let’s import the PieChart component in the index.tsx or other components and pass the props. Here's the code for the index.tsx
import { useEffect, useRef, useState } from 'react';

import PieChart from './PieChart';
import { randomNumber } from 'utils/helpers';

const Feature = () => {
  const [data, setData] = useState<any[]>([]);
  const svgLargeRef: any = useRef<SVGSVGElement>();
  const svgMediumRef: any = useRef<SVGSVGElement>();
  const svgSmallRef: any = useRef<SVGSVGElement>();

  useEffect(() => {
    const makeRandomData = () => {
      setData([]);
      ['JS', 'Python', '.Net', 'Java', 'GoLang', 'UI/UX']?.map((label) => {
        setData((prevData) => [...prevData, { label, value: randomNumber(10, 99), fillColor: `#${randomNumber()}` }]);
      });

      setTimeout(() => {
        makeRandomData();
      }, 1000 * 10);
    };

    makeRandomData();
  }, []);

  return (
    <div className="relative px-5 py-2">
      <div className="flex justify-center">
        <div className="w-[90vw] h-full">
          <h2 className="flex justify-between items-center font-semibold text-black mb-2">D3.js Chart</h2>
          <div className="flex w-full h-[75vh] justify-center items-start border border-dashed border-black text-white p-4 space-x-2">
            <div ref={svgLargeRef} className="w-5/12 h-72 border border-gray-300 p-1">
              <PieChart data={data} svgWrapperRef={svgLargeRef} padding={40} />
            </div>
            <div ref={svgMediumRef} className="w-4/12 h-72 border border-gray-300 p-1">
              <PieChart data={data} svgWrapperRef={svgMediumRef} padding={50} />
            </div>
            <div ref={svgSmallRef} className="w-3/12 h-72 border border-gray-300 p-1">
              <PieChart data={data} svgWrapperRef={svgSmallRef} padding={60} />
            </div>
          </div>
        </div>
      </div>
    </div>
  );
};

export default Feature;
The above code exports a functional React component called Feature which renders a PieChart using D3.js library. It imports React hooks like useEffect, useRef, and useState to handle side effects, store references to DOM elements, and manage state, respectively.
It imports a custom PieChart component from './PieChart' that takes in props such as data, svgWrapperRef, and padding. It also imports a custom helper function randomNumber from 'utils/helpers' to generate random numbers used in the chart data.
The useEffect hook is used to update the chart data every 10 seconds using makeRandomData function. The useState hook stores the chart data as an array of objects with properties such as label, value, and fillColor.
The component sets up three references (svgLargeRef, svgMediumRef, and svgSmallRef) using useRef hook
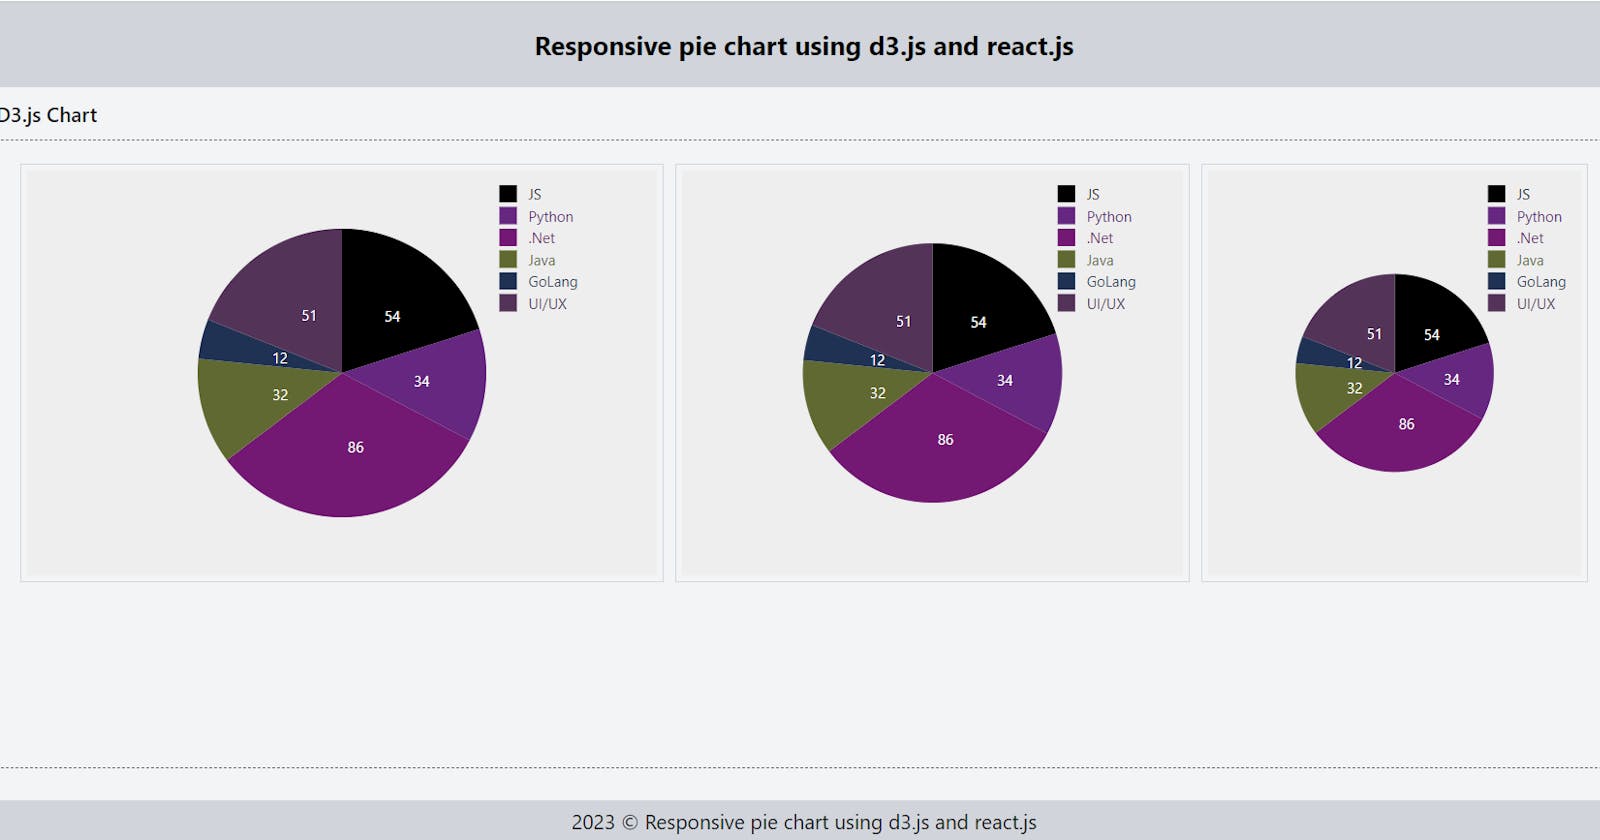
The returned JSX code renders three SVG elements containing the PieChart component with different padding and size configurations, each wrapped in a div with a reference obtained using the useRef hook.
The component's structure includes an outer <div> with some styles applied using CSS classes. Inside that, it has a nested set of <div> elements which are used to create the three different-sized PieCharts. Each chart references one of the three useRef elements and passes them as a prop to the PieChart component.
Summary
In this blog post, we explore how to create a responsive pie chart using D3.js and React.js. We begin by introducing the D3.js library and explaining its role in data visualization.
By the end of this blog post, readers should have a good understanding of how to create a responsive pie chart using D3.js and React.js and be able to apply this knowledge to their own projects. This can be useful for applications that need to display data in an interactive and visually appealing way.
I hope you found this tutorial helpful! If you have any questions or feedback, feel free to let me know.