

D3.js is a popular data visualization library that provides a lot of tools for creating interactive and dynamic visualizations. In this blog post, we'll cover how to create a line chart using D3.js in React.js.
Prerequisites
Before we get started, ensure that you have the following prerequisites:
Basic knowledge of HTML, CSS, and JavaScript
Node.js and npm installed on your system
A text editor like Visual Studio Code
Getting started
Let's create a new React.js project by running the following command in your terminal:
npx create-react-app responsive-line-chart-using-d3js-reactjs
This command creates a new React.js project with the name responsive-line-chart-using-d3js-reactjs. Navigate to the project directory by running the following command:
cd responsive-line-chart-using-d3js-reactjs
Open the project directory in your text editor. Next, install the d3 library by running the following command:
npm install d3
This command installs the latest version of the d3 library in your project.
Creating the line chart component
Create a new file named LineChart.tsx in the src/features directory of your project. This file will contain the code for the line chart component. Here's the code for the component:
import * as d3 from 'd3';
import { FC, useEffect, useRef } from 'react';

import Spinner from 'components/Spinner';
import { useResizeObserver } from 'hooks/useResizeObserver';

const LineChart: FC<IChart> = ({ data, svgWrapperRef, margin, isYaxisRight = false }) => {
  const dimensions: any = useResizeObserver(svgWrapperRef);
  const svgRef = useRef<SVGSVGElement>(null);

  useEffect(() => {
    if (!svgRef?.current || !dimensions) return;

    // Initialize the height, width and max value
    const innerWidth: number = dimensions?.width - margin?.right;
    const innerHeight: number = dimensions?.height - (margin?.top + margin?.bottom);
    const maxValue: number = Math.max(...data?.map(({ value }) => value));

    const svg = d3.select(svgRef?.current);
    svg.selectAll('.dot').remove();

    // Create x-axis scale
    const xScale: any = d3
      .scalePoint()
      .domain([...data?.map(({ label }) => label)])
      .range([margin?.left, innerWidth]);

    // Create y-axis scale
    const yScale: any = d3.scaleLinear().domain([0, maxValue]).rangeRound([innerHeight, margin?.top]);

    // Create x-axis
    const xAxis: any = d3.axisBottom(xScale).ticks(data?.length);
    svg
      .select('.x-axis')
      .style('transform', `translateY(${innerHeight}px)`)
      .style('color', 'steelblue')
      .style('font-size', 10)
      .call(xAxis)
      .selectAll('text')
      .style('text-anchor', 'end')
      .attr('dx', '-5px')
      .attr('dy', '4px')
      .attr('transform', 'rotate(-30)');

    // Create y-axis for left side
    const yAxis: any = d3.axisLeft(yScale).ticks(5);
    svg
      .select('.y-axis')
      .style('transform', `translateX(${margin?.left}px)`)
      .style('color', 'steelblue')
      .style('font-size', 10)
      .call(yAxis);

    // Create y-axis for right side
    const yAxisRight: any = d3.axisRight(yScale).ticks(5);
    svg
      .select('.y-axis-right')
      .style('transform', `translateX(${dimensions?.width - margin?.right}px)`)
      .style('color', 'steelblue')
      .style('font-size', 10)
      .call(yAxisRight);

    // Draw line
    const lineGenerator = d3
      .line<IData>()
      .x((d) => xScale(d?.label) + xScale.bandwidth() / 2)
      .y((d) => yScale(d?.value))
      .curve(d3.curveCardinal);

    svg
      .select('.line')
      .datum([...data])
      .attr('fill', 'none')
      .attr('stroke', 'steelblue')
      .attr('stroke-width', 1)
      .attr('d', lineGenerator);

    svg
      .selectAll('.dot')
      .data([...data])
      .enter()
      .append('circle')
      .attr('class', 'dot')
      .attr('cx', (d) => xScale(d?.label) + xScale.bandwidth() / 2)
      .attr('cy', (d) => yScale(d?.value))
      .attr('r', 5)
      .style('cursor', 'pointer')
      .style('fill', ({ fillColor }) => fillColor)
      .on('mouseenter', (event, item) => {
        svg
          .selectAll('.tooltip')
          .data([item?.value])
          .join((enter) => enter.append('text').attr('y', yScale(item?.value) - 4))
          .attr('class', 'tooltip')
          .text(`${item?.value}`)
          .attr('x', xScale(item?.label) + xScale.bandwidth() / 2)
          .style('font-size', '10px')
          .attr('text-anchor', 'middle')
          .transition()
          .duration(500)
          .attr('y', yScale(item?.value) - 8)
          .style('font-size', '14px')
          .style('fill', item?.fillColor)
          .style('opacity', 1);
      })
      .on('mouseleave', () => svg.select('.tooltip').remove());
  }, [data, dimensions]);

  if (!dimensions) {
    return (
      <div className="flex w-full justify-center items-center py-2">
        <Spinner className="text-gray-300 h-8 w-8" />
      </div>
    );
  }

  return (
    <div className="d3js">
      <svg ref={svgRef} width={`${dimensions?.width}`} height={dimensions?.height}>
        <g className="x-axis" />
        {isYaxisRight ? <g className="y-axis-right" /> : <g className="y-axis" />}
        <path className="line" />
      </svg>
    </div>
  );
};

interface IData {
  label: string;
  value: number;
  fillColor: string;
}

interface IChart {
  data: IData[];
  svgWrapperRef: any;
  margin: {
    top: number;
    right: number;
    bottom: number;
    left: number;
  };
  isYaxisRight?: boolean;
}

export default LineChart;
The above code creates a reusable line chart component for displaying data points, built with d3.js and React.js. The component expects to receive data in the form of an array of objects, where each object has three properties: label (a string), value (a number), and fillColor (a string). It also expects to receive a svgWrapperRef (a reference to the wrapper element for the chart), a margin object (with properties top, right, bottom, and left for the margins of the chart), and a boolean isYaxisRight (to indicate whether the y-axis is on the right side of the chart).
The useResizeObserver hook is used to observe the size of the svgWrapperRef element and update the chart when the size changes.
The useEffect hook is used to render the chart when the data or dimensions change. The code initializes the height, width, and max value for the chart, selects the SVG element, and creates the x and y scales, axes, and line using d3 methods. It also creates a dot for each data point, with hover functionality to display a tooltip. Finally, if the dimensions are not yet available, the component displays a spinner until they are.
Let’s import the LineChart component in the app.tsx or other components and pass the props. Here's the code for the app.tsx
import { useEffect, useRef, useState } from 'react';

import LineChart from './LineChart';
import { randomNumber } from 'utils/helpers';

const Feature = () => {
  const margin = { top: 20, right: 10, bottom: 20, left: 30 };
  const [data, setData] = useState<any[]>([]);
  const svgLargeRef: any = useRef<SVGSVGElement>();
  const svgMediumRef: any = useRef<SVGSVGElement>();
  const svgSmallRef: any = useRef<SVGSVGElement>();

  useEffect(() => {
    const makeRandomData = () => {
      setData([]);
      ['JS', 'Python', '.Net', 'Java', 'GoLang', 'UI/UX']?.map((label) => {
        setData((prevData) => [...prevData, { label, value: randomNumber(10, 99), fillColor: `#${randomNumber()}` }]);
      });

      setTimeout(() => {
        makeRandomData();
      }, 1000 * 10);
    };

    makeRandomData();
  }, []);

  return (
    <div className="relative px-5 py-2">
      <div className="flex justify-center">
        <div className="w-[90vw] h-full">
          <h2 className="flex justify-between items-center font-semibold text-black mb-2">D3.js Chart</h2>
          <div className="flex w-full h-[75vh] justify-center items-start border border-dashed border-black text-white p-4 space-x-2">
            <div ref={svgLargeRef} className="w-5/12 h-72 border border-gray-300 p-1">
              <LineChart data={data} svgWrapperRef={svgLargeRef} margin={margin} isYaxisRight={false} />
            </div>
            <div ref={svgMediumRef} className="w-4/12 h-72 border border-gray-300 p-1">
              <LineChart data={data} svgWrapperRef={svgMediumRef} margin={margin} isYaxisRight={false} />
            </div>
            <div ref={svgSmallRef} className="w-3/12 h-72 border border-gray-300 p-1">
              <LineChart
                data={data}
                svgWrapperRef={svgSmallRef}
                margin={{ ...margin, left: 10, right: 30 }}
                isYaxisRight={true}
              />
            </div>
          </div>
        </div>
      </div>
    </div>
  );
};

export default Feature;
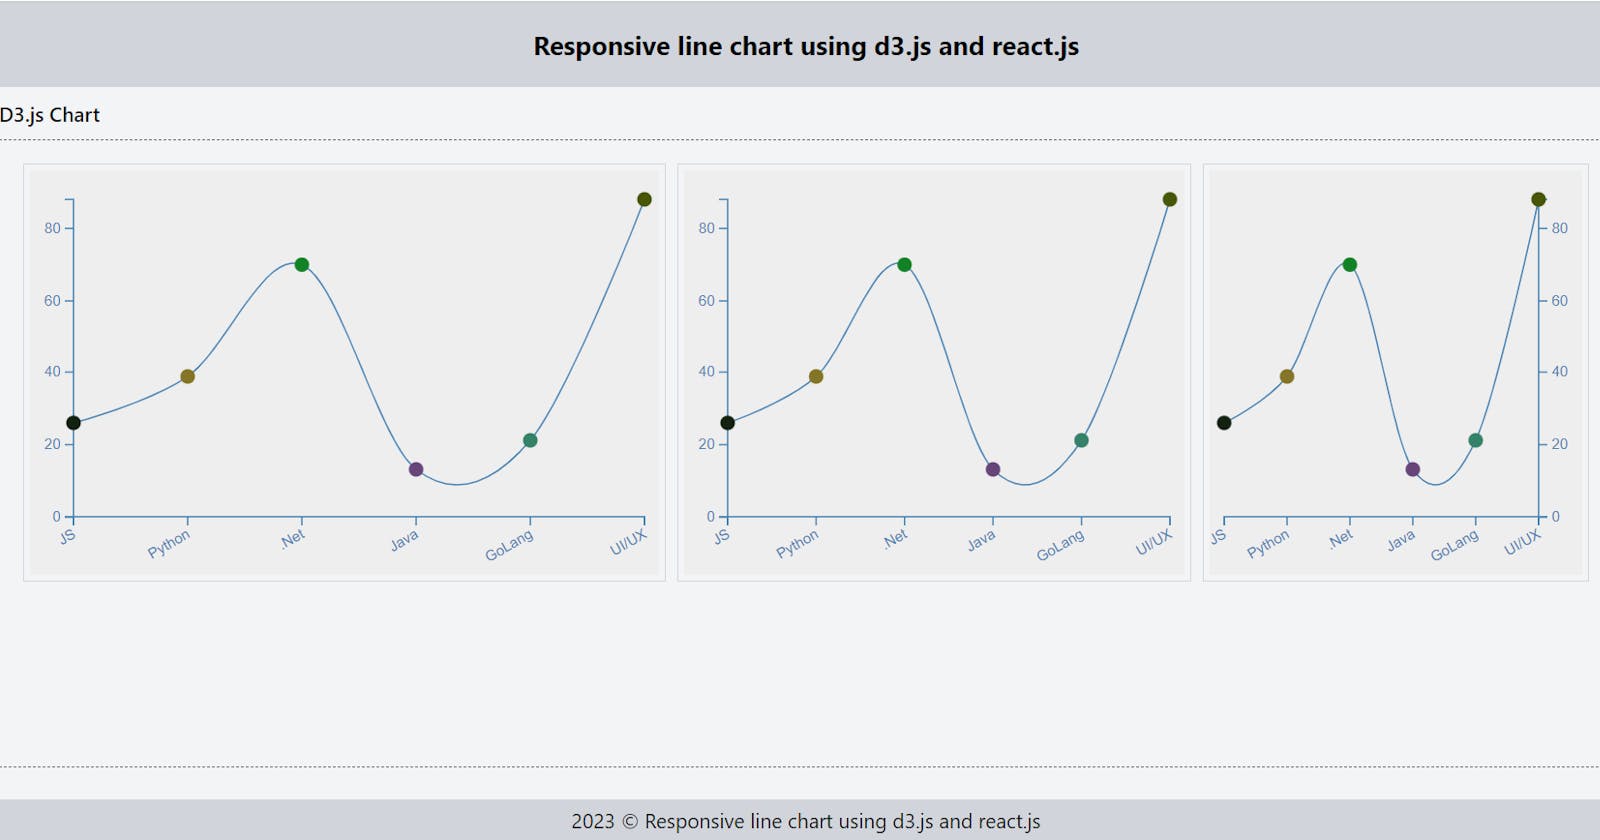
The above code defines a React functional component called Feature, which renders a set of three line charts using the D3.js library.
The component imports useEffect, useRef, and useState from the react library, and imports a randomNumber function from a utils/helpers module.
The Feature component initializes state using the useState hook with an empty array for the data variable. It also initializes three refs using the useRef hook, which are used to reference the SVG elements that will be rendered for each line chart.
The useEffect hook is used to generate new random data for the charts and update the data state every 10 seconds. The makeRandomData function updates the data state by generating an array of objects containing a label, a value, and a fillColor for each chart. The randomNumber function is used to generate random values for the charts.
The component renders a div element that contains three child div elements, each representing a line chart. Each child div element references a different SVG element using the ref attribute and passes the data and other chart properties to the LineChart component.
The LineChart component is not defined in the code provided, but based on its usage, it appears to be a custom component that renders a line chart using D3.js. It receives the data, a reference to the SVG wrapper element, a margin object, and a boolean value indicating whether the y-axis should be on the right or left side of the chart.
Overall, the Feature component generates and renders three line charts using D3.js, which update with new random data every 10 seconds.
Summary
This blog post is a useful and informative tutorial for anyone looking to create interactive data visualizations using D3.js and React.js.
I hope you found this tutorial helpful! If you have any questions or feedback, feel free to let me know.